Table of Contents
ProM Visualizer: Event Filter on Event Log
Overview
- Package: FilterD
- Purpose: Event Log Filtering, Event Log Pre-Processing, Repeatable Analysis
- Short Description:
- The event filter provides a visualizer for an event log.
- It allows a user to interactively define a stack of Simple Event Log Filters (applied in order) and visualize the outcomes using any of the ProM event log visualizers including any event data visualization and visual miners.
- Offers over 15 different basic filters to select a subset of traces, project traces onto a subset, aggregate events, and derive new attributes
- The resulting event log can be exported to the workspace for further analysis.
- The filter stack can be documented in a free text field.
- The filter stack can be exported to workspace and to file .xpmef.
- An imported xmpef event filter stack can be used to
- continue or reproduce a previous analysis
- apply the same filtering operations on a different data set, or a new sample (e.g., next year of the data)
When to use
- exploring the event data: combines filtering of event data with data visualization in an interactive manner
- event log is too complex/discovery algorithms fail to return trustworthy results: filter out problematic/infrequent behavior
- analyzing variants of a process: select subsets of the data based on attributes or behavioral properties
- making preprocessing repeatable: export filters and configurations and apply them on a new log
We recommend the event filter visualization as the default visualization when you are exploring any event log in ProM.
How to run
- Run the Filter Event Log plugin on an Event Log
- Run the Filter Event Log plugin on an Event Log and an existing Event Filter object (import from (from
.xpmef) - or: launch as event log visualizer
- Select the Event Log in the workspace
- Visualize the event log (view icon)
- Select “Event Filter on Event Log” from ProM visualizer drop down menu (top right)
Visualizer Options
The event log visualizer has two cells…
- The event filter stack cell (top) to view the log, define filters, and export the event log, and
- The description cell (bottom) to enter free text to document your event log analysis and filtering
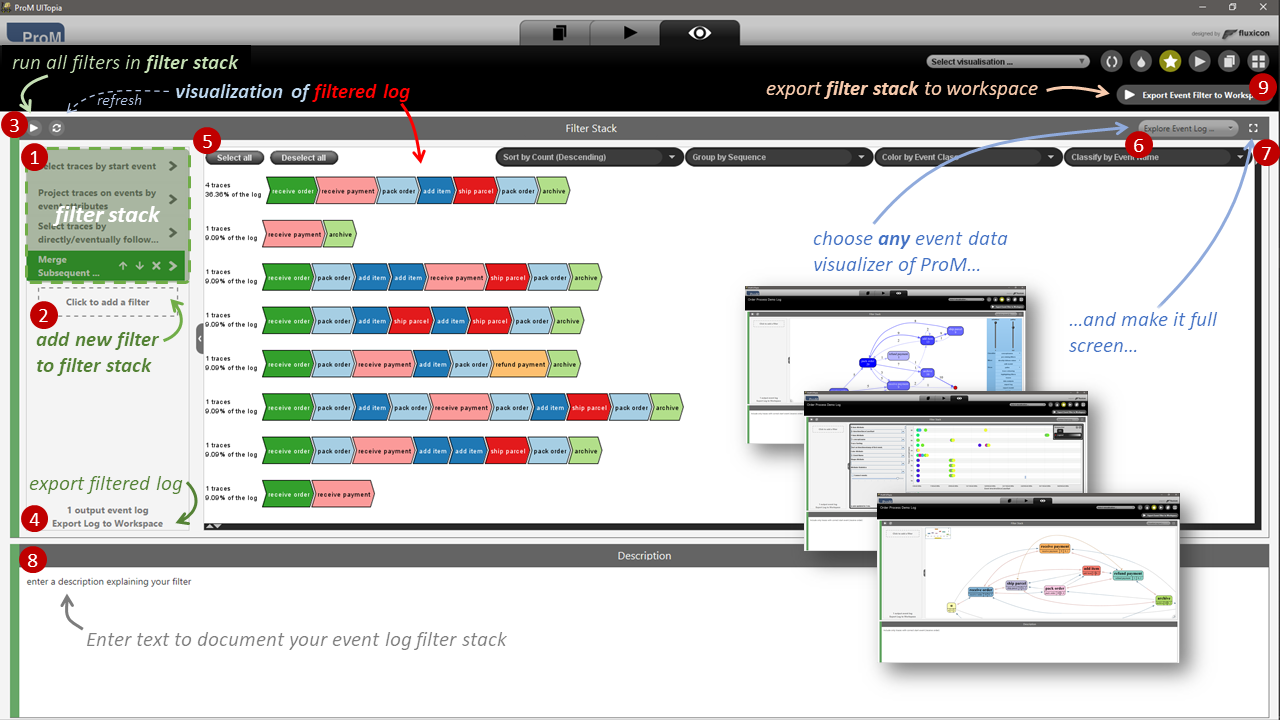
The Event Filter Cell contains
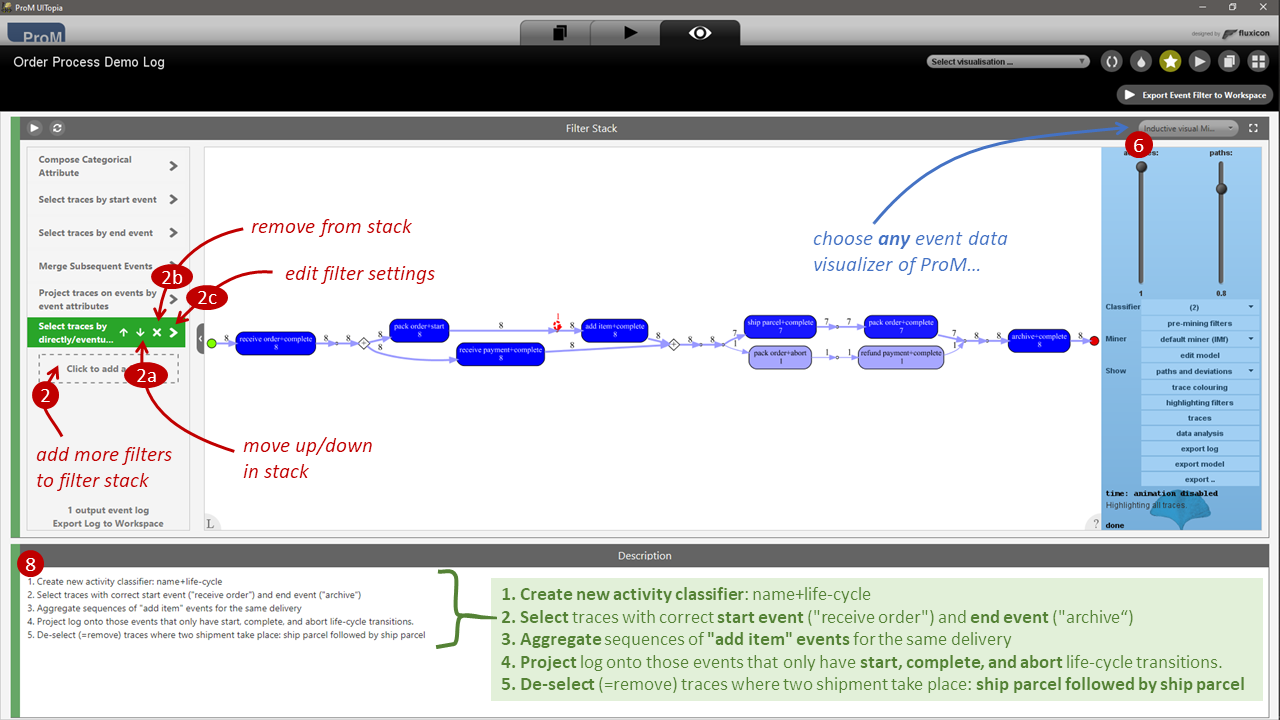
- The filter stack (1) is shown on the left.
- Add new filter (2): adds a new filter to stack, see Simple Event Log Filters for available filters
- Filter in stack: can be reordered in stack (up/down), deleted (X), and configured (>)
- Run (3) to apply all filters in the stack
- Export (4) filtered log to the ProM workspace, for further analysis, e.g., process discovery, conformance checking
- preview of the current filtered event log (5)
- you can choose any ProM Event Log Visualizers (6), default is Explore Event Log,
- make the visualization fullscreen (7) to see all data and to intract with all controls of the visualizer
- the visualization will be refreshed automatically when pressing Run (3), click the reload button to refresh preview visualization manually
- Note: If a visualizer offers controls to adapt the visualization the preview visualization may show these UI controls but they may not be responsive. Make the visualizer full screen (7) to interact with it as usual.
- Filter stack status bar (bar on the left) indicates whether the visualization is up to date regarding the current filter stack:
- grey = “dirty”: filter configuration was updated but hasn’t been run yet
- yellow = “running”: currently filtering, wait until it is completed to see results
- Green = “good”: filter was run, visualization shows result of current filter stack result
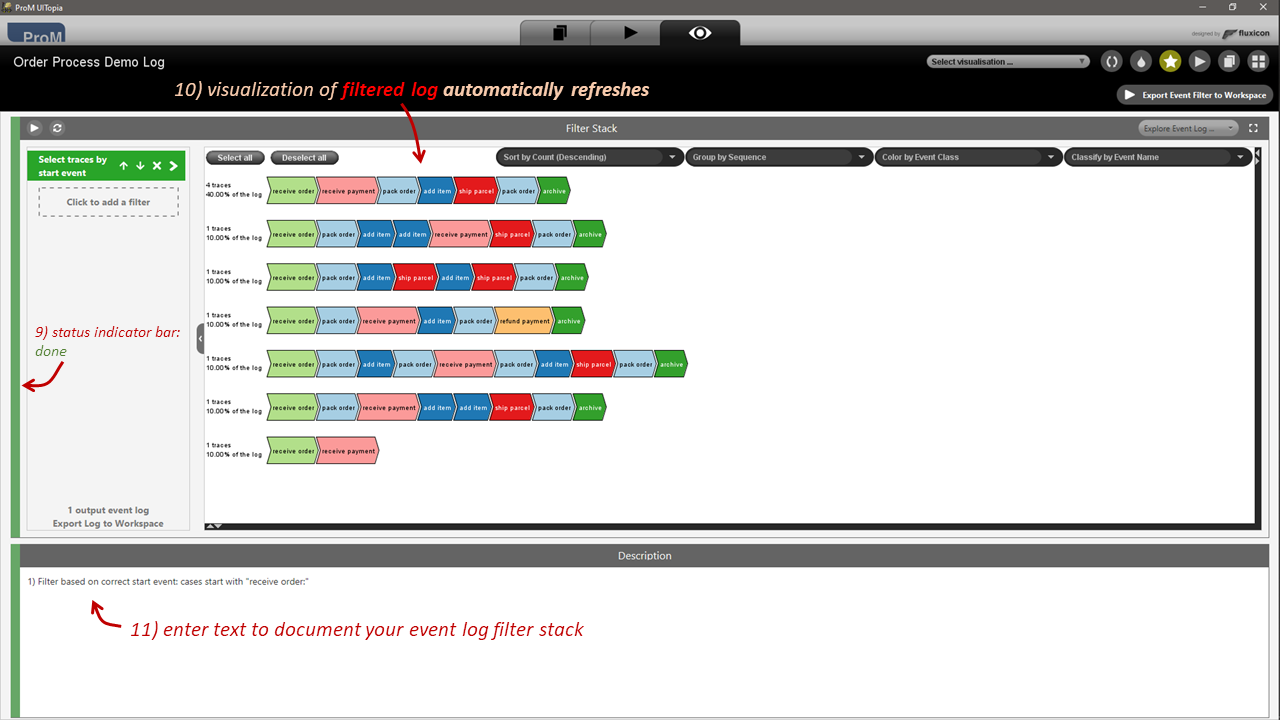
The Description Cell contains a text field to document your filtering (8). Will be stored when exporting the filter stack, allows understanding the reasoning for filtering and the analysis hypotheses
You can export filter stack to workspace (9) as an Event Filter object. The event filter object can be
- Exported to file (
.xmpef) - Applied on a different event log using the Filter Event Log plugin
Short Walkthrough
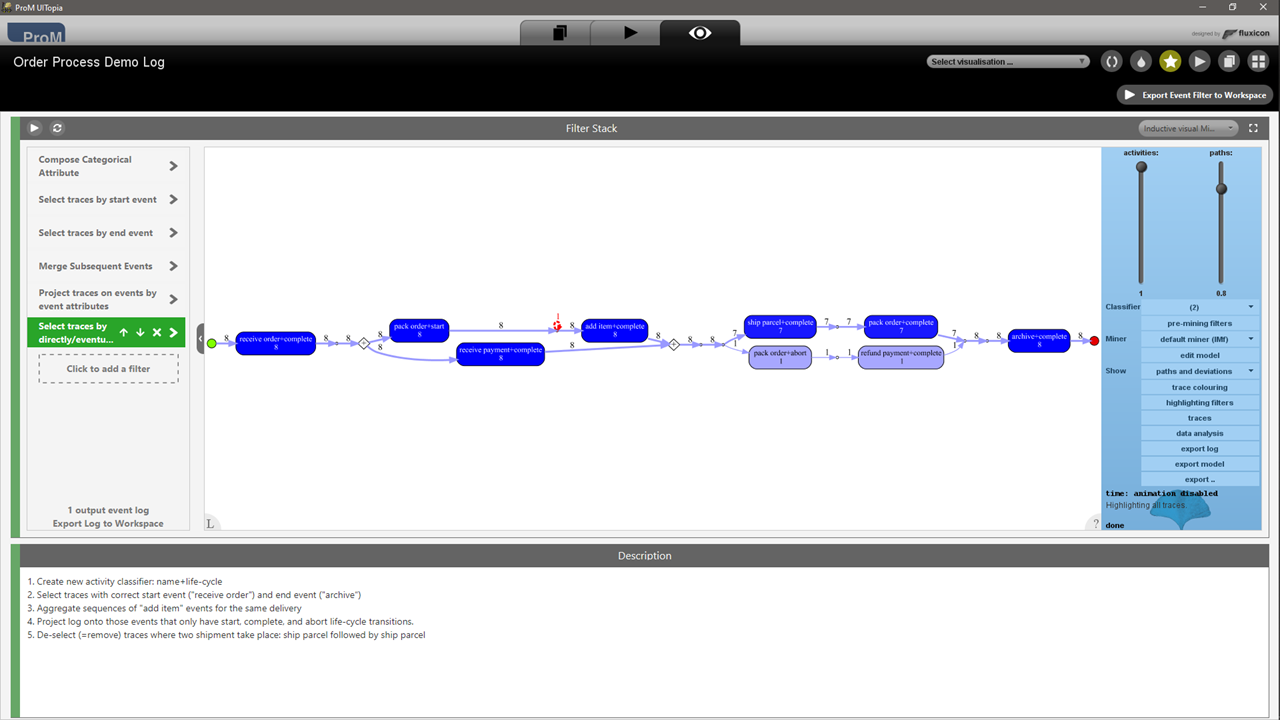
The walk-through uses a small demo event log order_process_demo.xes.gz and shows how to construct a more advanced filter to identify the main behavior in the process order_process_demo_main_behavior.xpmef
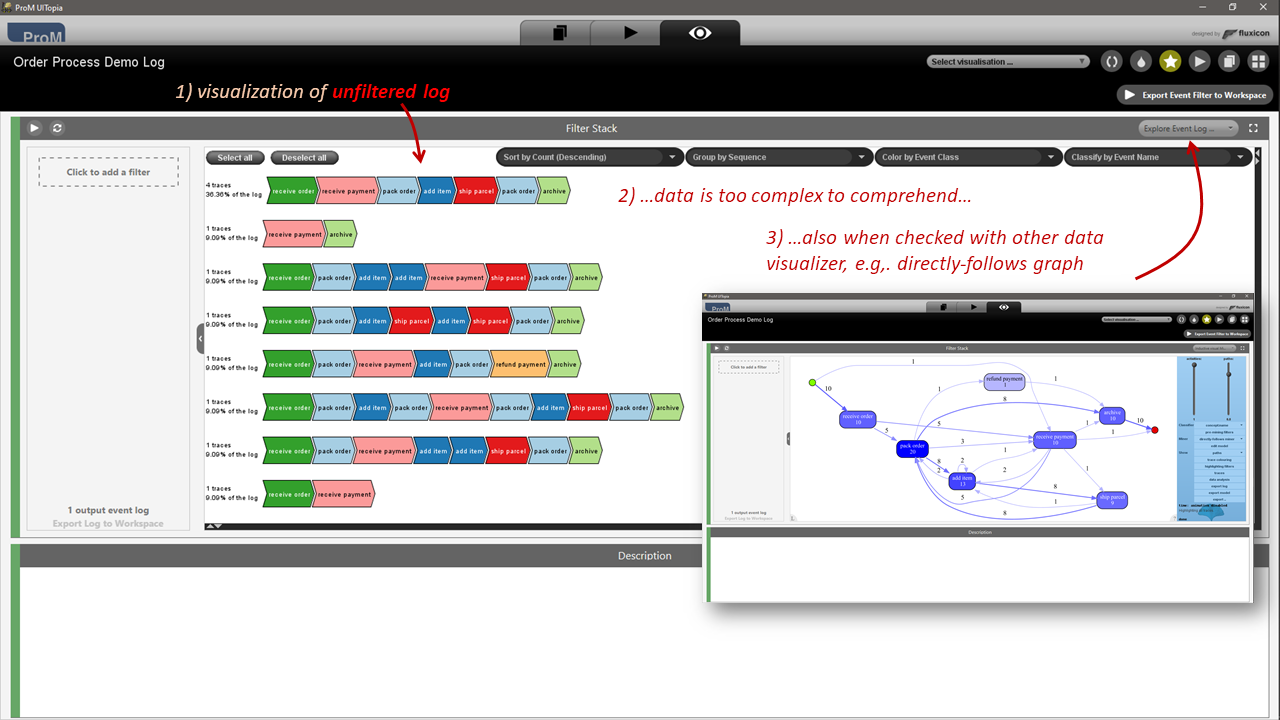
Load and Explore Log
1) Load your event log in ProM, run Filter Event Log or choose the “Event Filter on Event Log” visualizer
2) You see your raw event log and notice that the log has many different variants, no clear patterns.
3) Also when you choose different visualizer (drop down menu in the filter stack cell), eg. Inductive Visual Miner when choosing inductive miner infrequent or the directly-follows miner, no insights can be gained
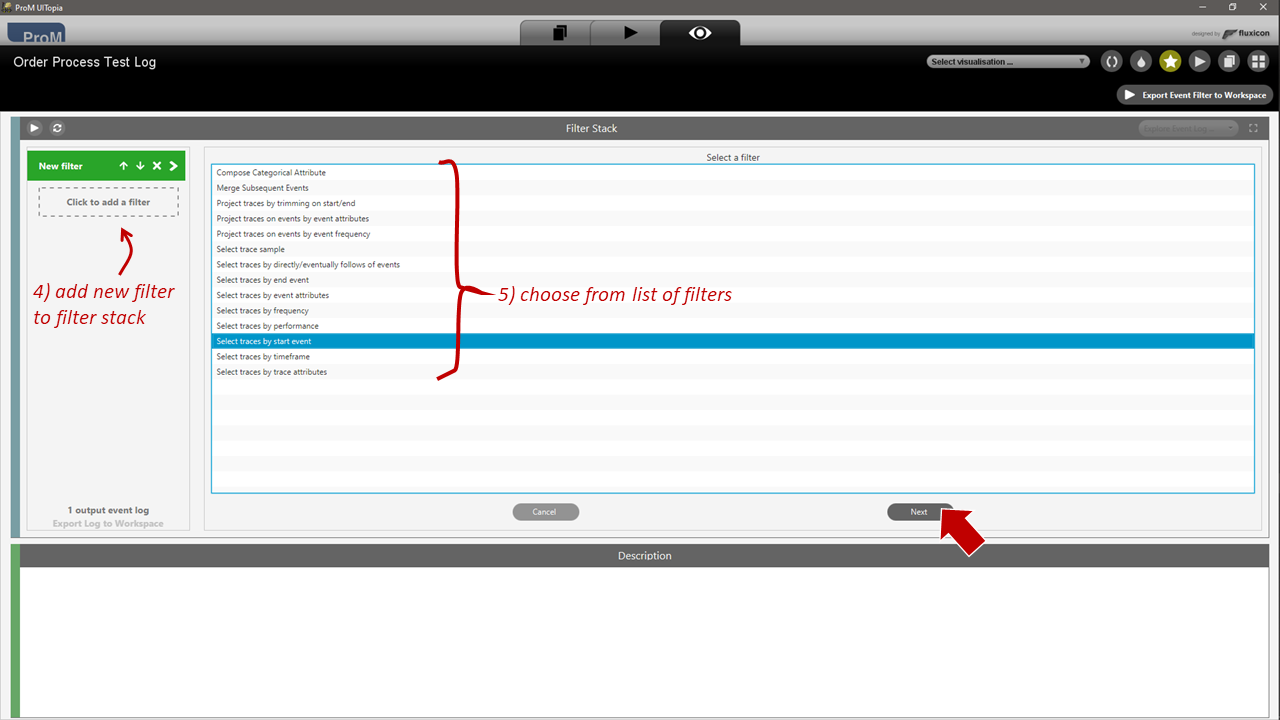
Add and configure a filter
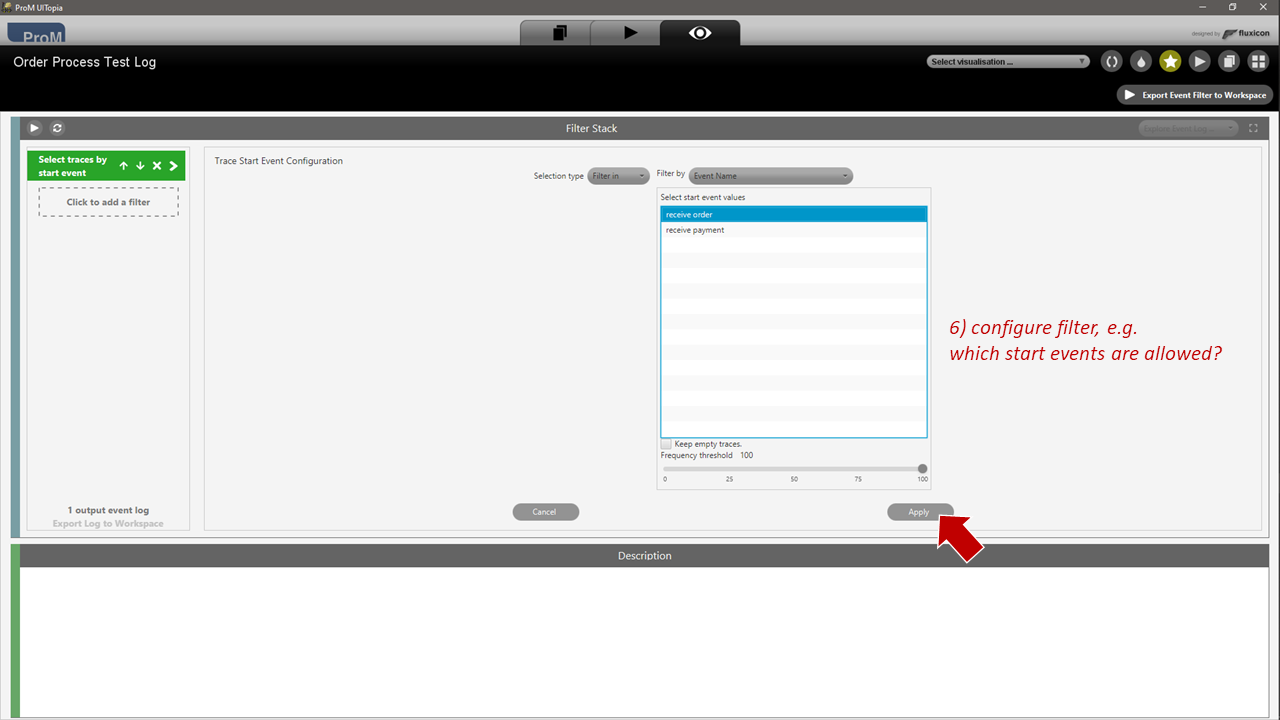
4) You can add a filter to reduce event log complexity by choosing Add filter > choose one of the filters, see Simple Event Log Filters, (e.g. select traces based on start event) > Apply </block>
5) You see the configuration screen of the filter, choose your configuration options (e.g., which start event the traces may have) > Apply
Run to apply all filters and explore filtered results
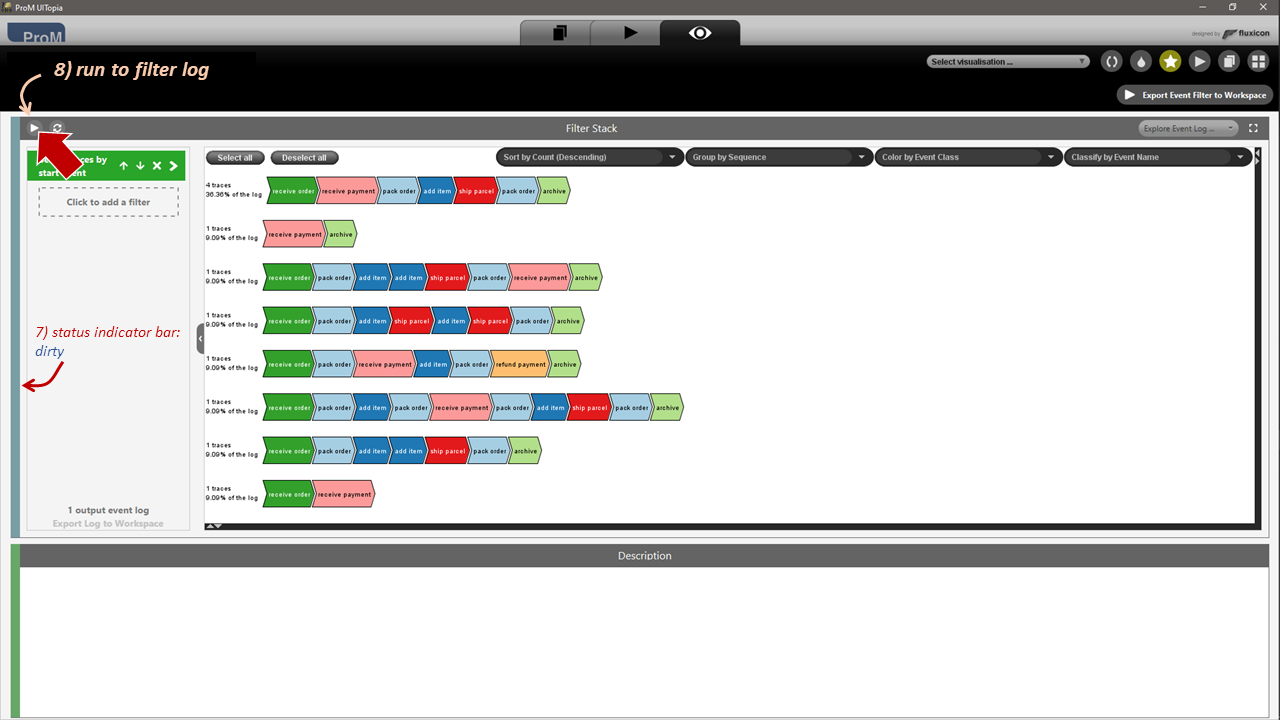
6) After adding or changing a filter, the status bar becomes grey, meaning the shown event log is not consistent with the configured filter
7) Choose Run to execute all filters > status bar becomes yellow (busy) > wait for the status bar to become green (done)
8) The visualization refreshes automatically, now showing the filtered log, e.g. only the traces starting with the chosen start activities
Add more filters, edit stack, change visualizers
9) We can add more filters to the stack from the different filter categories, you can also edit the filters in the stack
- Change position in the stack (up/down arrows)
- Remove a filter (X)
- Edit a filter configuration (right arrow >)
Examples
Real-Life Event Logs
-
- bpic17_main_behavior.xpmef - event filter to filter the main behavior of the process
Synthetic and Demo Event Logs
- order_process_demo.xes.gz Order Process with unusual variants and deviations
- order_process_demo_main_behavior.xpmef -filter out incomplete cases and deviations to identify the main behavior